Uncategorized

Homeowner’s Net Worth Is Still Greater Than a Renter’s

Homeowner’s Net Worth Is Still Greater Than a Renter’s | Simplifying The Market

Every three years, the Federal Reserve conducts their Survey of Consumer Finances in which they collect data across all economic and social groups. The latest survey, which includes data from 2010-2013, reports that a homeowner’s net worth is 36 times greater than that of a renter ($194,500 vs. $5,400). 

The latest survey data, covering 2014-2016 will be released later this year. In the meantime, Lawrence Yun, the National Association of Realtors’ Chief Economist estimates that the gap has widened even further, to 45 times greater ($225,000 vs. $5,000)! 

Put Your Housing Cost to Work for You

As we’ve said before, simply put, homeownership is a form of ‘forced savings.’ Every time you pay your mortgage, you are contributing to your net worth. Every time you pay your rent, you are contributing to your landlord’s net worth.

The latest National Housing Pulse Survey from NAR reveals that 84% of consumers believe that purchasing a home is a good financial decision. William E. Brown comments:

“Despite the growing concern over affordable housing, this survey makes it clear that a strong majority still believe in homeownership and aspire to own a home of their own. Building equity, wanting a stable and safe environment, and having the freedom to choose their neighborhood remain the top reasons to own a home. 

Bottom Line

If you are interested in finding out if you could put your housing cost to work for you by purchasing a home, let’s get together and evaluate your ability to buy today!

Powered by WPeMatico

What State Gives You the Most ‘Bang for Your Buck’? [INFOGRAPHIC]

What State Gives You the Most ‘Bang for Your Buck’? [INFOGRAPHIC] | Simplifying The Market

What State Gives You the Most ‘Bang for Your Buck’? [INFOGRAPHIC] | Simplifying The Market

Some Highlights:

  • Thinking of moving across the country? How far will your money take you?
  • The majority of states in the Midwest and South offer a lower cost of living compared to Northeast and Western states.
  • The ‘Biggest Bang for your Buck’ comes in Mississippi where, compared to the national average, you can actually purchase $116.01 worth of goods for $100.
  • For more information regarding the methodology used to create the map, visit the Tax Foundation.

Powered by WPeMatico

Hey, Millennial Homeowners!! It May Be Time to Sell

Hey, Millennial Homeowners!! It May Be Time to Sell | Simplifying The Market

Contrary to what many believe, Millennials are not the ‘renter’ generation. Millennials purchased a larger percentage (34%) of homes in the U.S. than any other age group in 2017 and the most recent Census Bureau report shows that the homeownership rate among Millennials is finally on the rise.

Many Millennials took advantage of post housing crash prices and the First-Time Homebuyers’ Tax Credit and jumped into homeownership in 2010. If you are one of these buyers, now may be the time to sell for many reasons. Here are a few:

1. Equity Build-Up

Home prices have been on the rise since the beginning of 2012 and your house may have appreciated by more than you think. ATTOM Data Solutions, in their Q2 2017 U.S. Home Sales Report revealed that:

“…homeowners who sold in the second quarter realized an average price gain of $51,000 since purchase — the highest average price gain for home sellers since Q2 2007, when it was $57,000.

The average home seller price gain of $51,000 in Q2 2017 represented an average return of 26 percent on the previous purchase price of the home, the highest average home seller return since Q3 2007, when it was 27 percent.”

2. Projected Home Price Increases

If you just got married or just found out you are about to become a parent, you may have plans to move up a bigger home or perhaps move to a different area. Waiting to buy a more expensive home in this market probably doesn’t make sense. The experts contacted for the Home Price Expectation Survey are projecting home prices to increase by nearly 5% over the next year. Yes, your house’s price will increase but not as much as a home currently valued higher than yours.

3. Projected Interest Rate Increases

The Mortgage Bankers’ Association, Freddie Mac, Fannie Mae and the National Association of Realtors are each projecting mortgage rates to increase over the next year.

Higher PRICES + Higher INTEREST RATES = LARGER MORTGAGE PAYMENTS.

Bottom Line

If you are lucky enough to be one of those Millennials who purchased a house in 2010 (or even later), now might be the perfect time to move up to the home of your dreams!

Powered by WPeMatico

Housing Inventory Hits 30-Year Low

Housing Inventory Hits 30-Year Low

Spring is traditionally the busiest season for real estate. Buyers, experiencing cabin fever all winter, emerge like flowers through the snow in search of their dream home. Homeowners, in preparation for the increased demand, are enticed to list their house for sale and move on to the home that will better fit their needs.

New data from CoreLogic shows that even though buyers came out in force, as predicted, homeowners did not make the jump to list their home in the second quarter of this year. Frank Nothaft, Chief Economist for CoreLogic had this to say,

“The growth in sales is slowing down, and this is not due to lack of affordability, but rather a lack of inventory. As of Q2 2017, the unsold inventory as a share of all households is 1.9 percent, which is the lowest Q2 reading in over 30 years.”

CoreLogic’s President & CEO, Frank Martell added,

“Home prices are marching ever higher, up almost 50 percent since the trough in March 2011.

While low mortgage rates are keeping the market affordable from a monthly payment perspective, affordability will likely become a much bigger challenge in the years ahead until the industry resolves the housing supply challenge.”

Overall inventory across the United States is down for the 25th consecutive month according to the latest report from the National Association of Realtors and now stands at a 4.3-month supply.

Real estate is local.

Market conditions in the starter and trade-up home markets are in line with the median US figures, but conditions in the luxury and premium markets are following an opposite path. Premium homes are staying on the market longer with ample inventory to suggest a buyer’s market.

Bottom Line

Buyers are out in force, and there has never been a better time to move-up to a premium or luxury home. If you are considering selling your starter or trade-up home and moving up this year, let’s get together to discuss the exact conditions in our area.

Powered by WPeMatico

93.9% Of Homes in The US Have Positive Equity

93.9% Of Homes in The US Have Positive Equity | Simplifying The Market

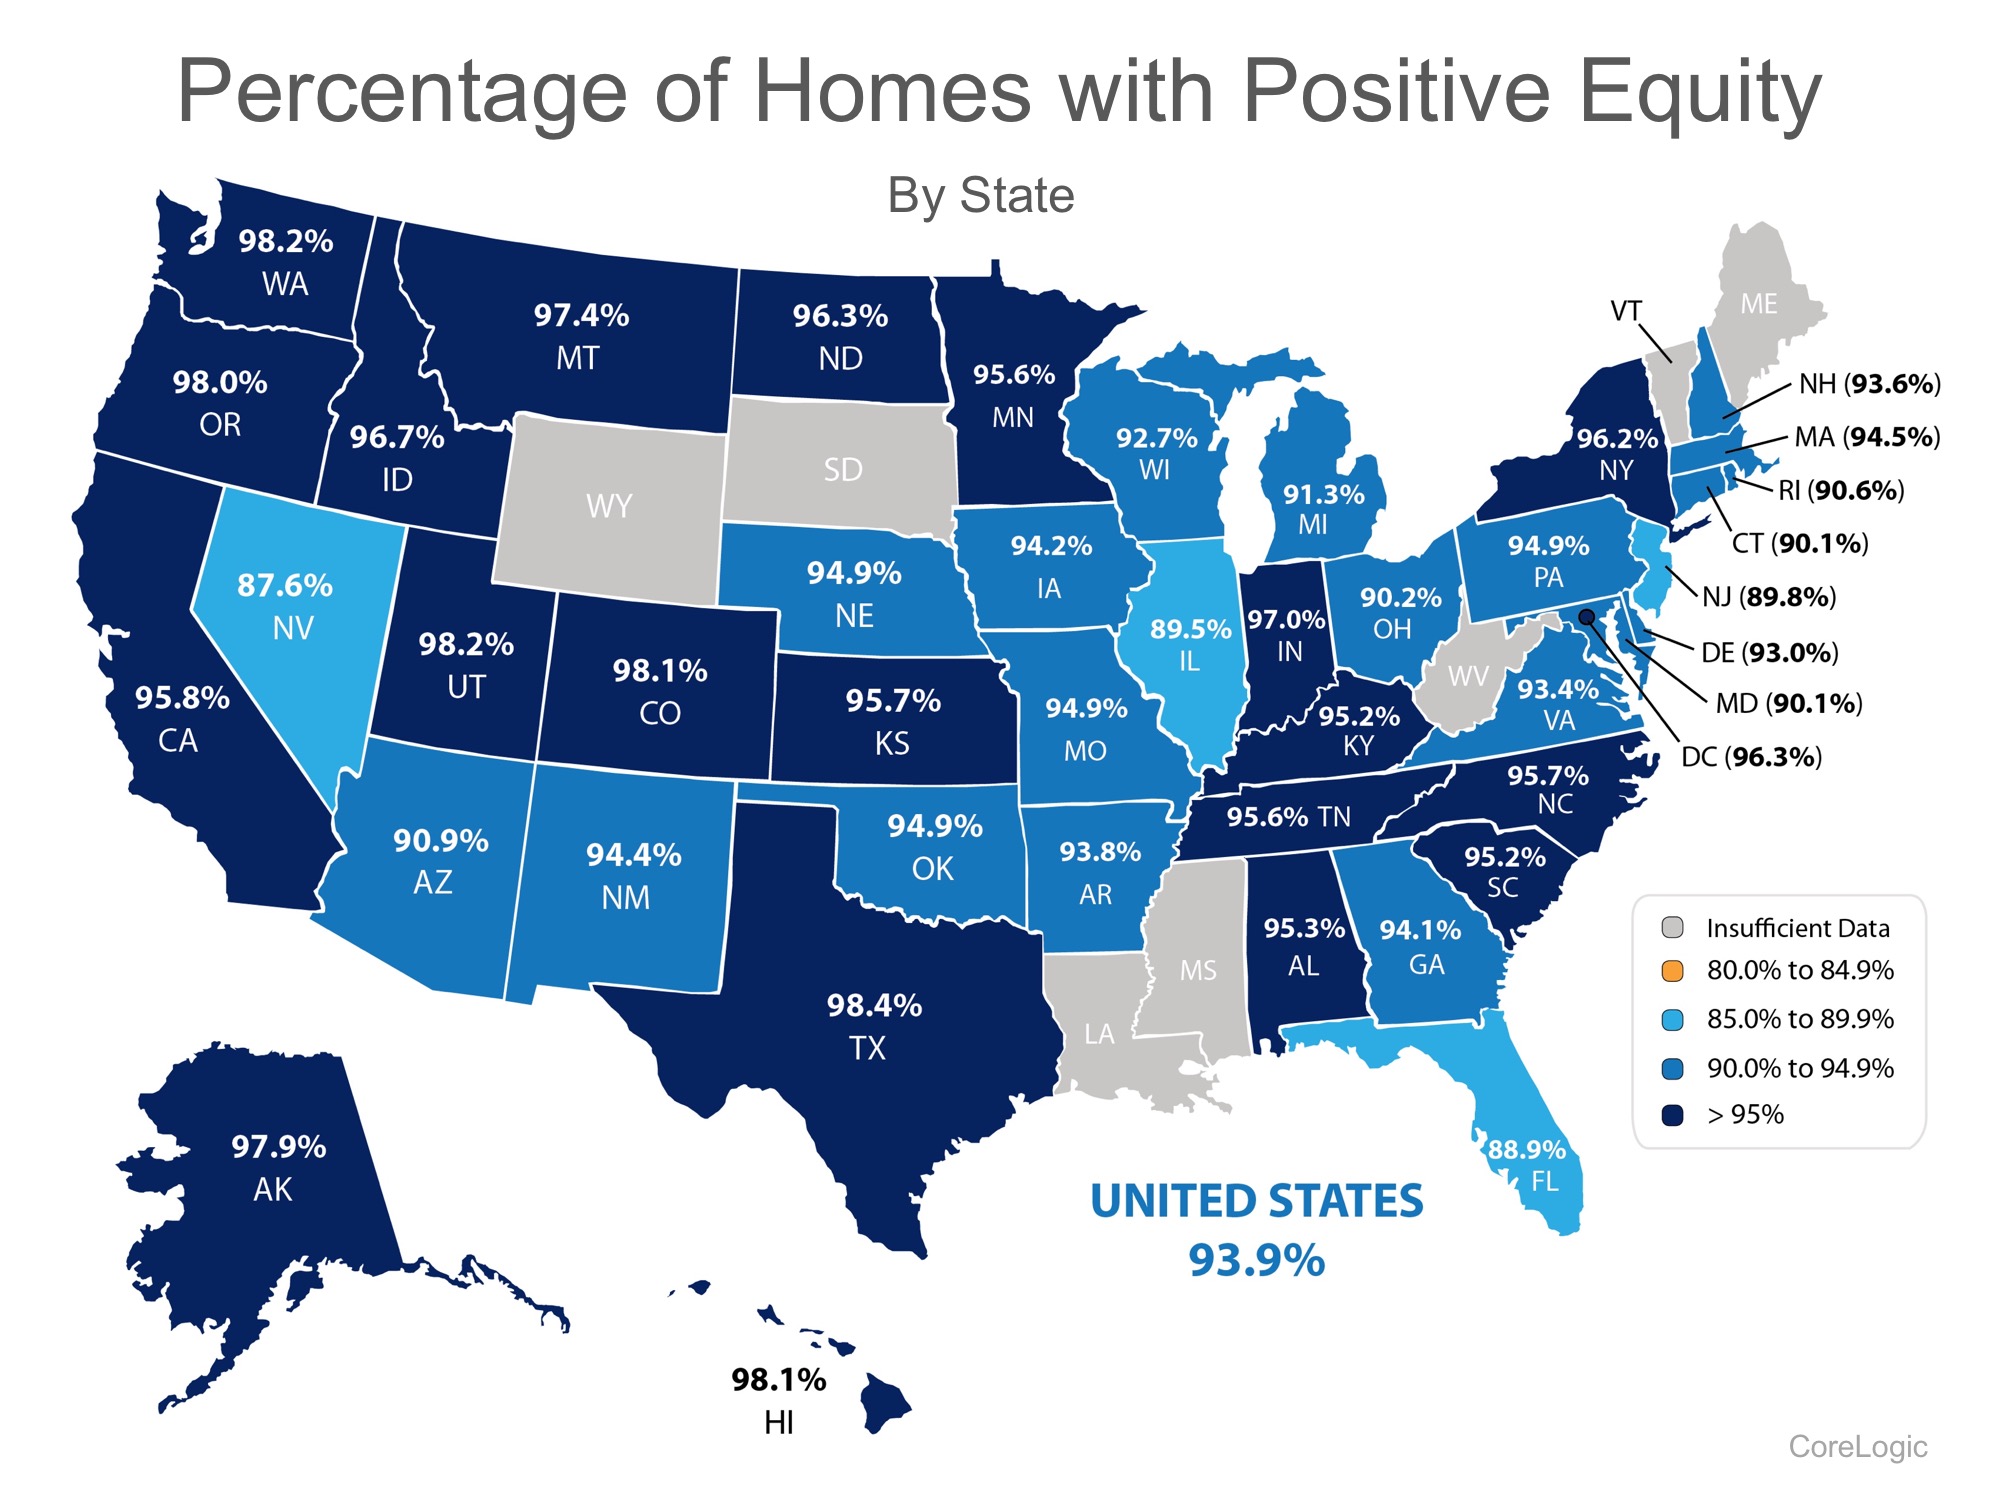
CoreLogic’s latest Equity Report revealed that ninety-one thousand residential properties regained equity in Q1 2017. The outlook for 2017 remains positive as well, as an additional 600 thousand properties will regain equity if home prices rise another 5% this year. 

The study also revealed that:

  • Roughly 63% of all homeowners have seen their equity increase since Q1 2016
  • The average homeowner gained about $14,000 in equity between Q1 2016 and Q1 2017
  • Only 1.6% of residential properties are near-negative equity

Below is a map showing the percentage of homes with a mortgage, in each state, that have positive equity. (The states in gray have insufficient data to report.)

93.9% Of Homes in The US Have Positive Equity | Simplifying The Market

Significant Equity Is On The Rise

Frank Martell, President & CEO of CoreLogic, believes this is great news for the “long-term health of the U.S. economy.” He went on to say:

“Homeowner equity increased by $766 billion over the last year, the largest increase since Q2 2014. The rising cushion of home equity is one of the main drivers of improved mortgage performance. Since home equity is the largest source of homeowner wealth, the increase in home equity also supports consumer balance sheets, spending and the broader economy.”

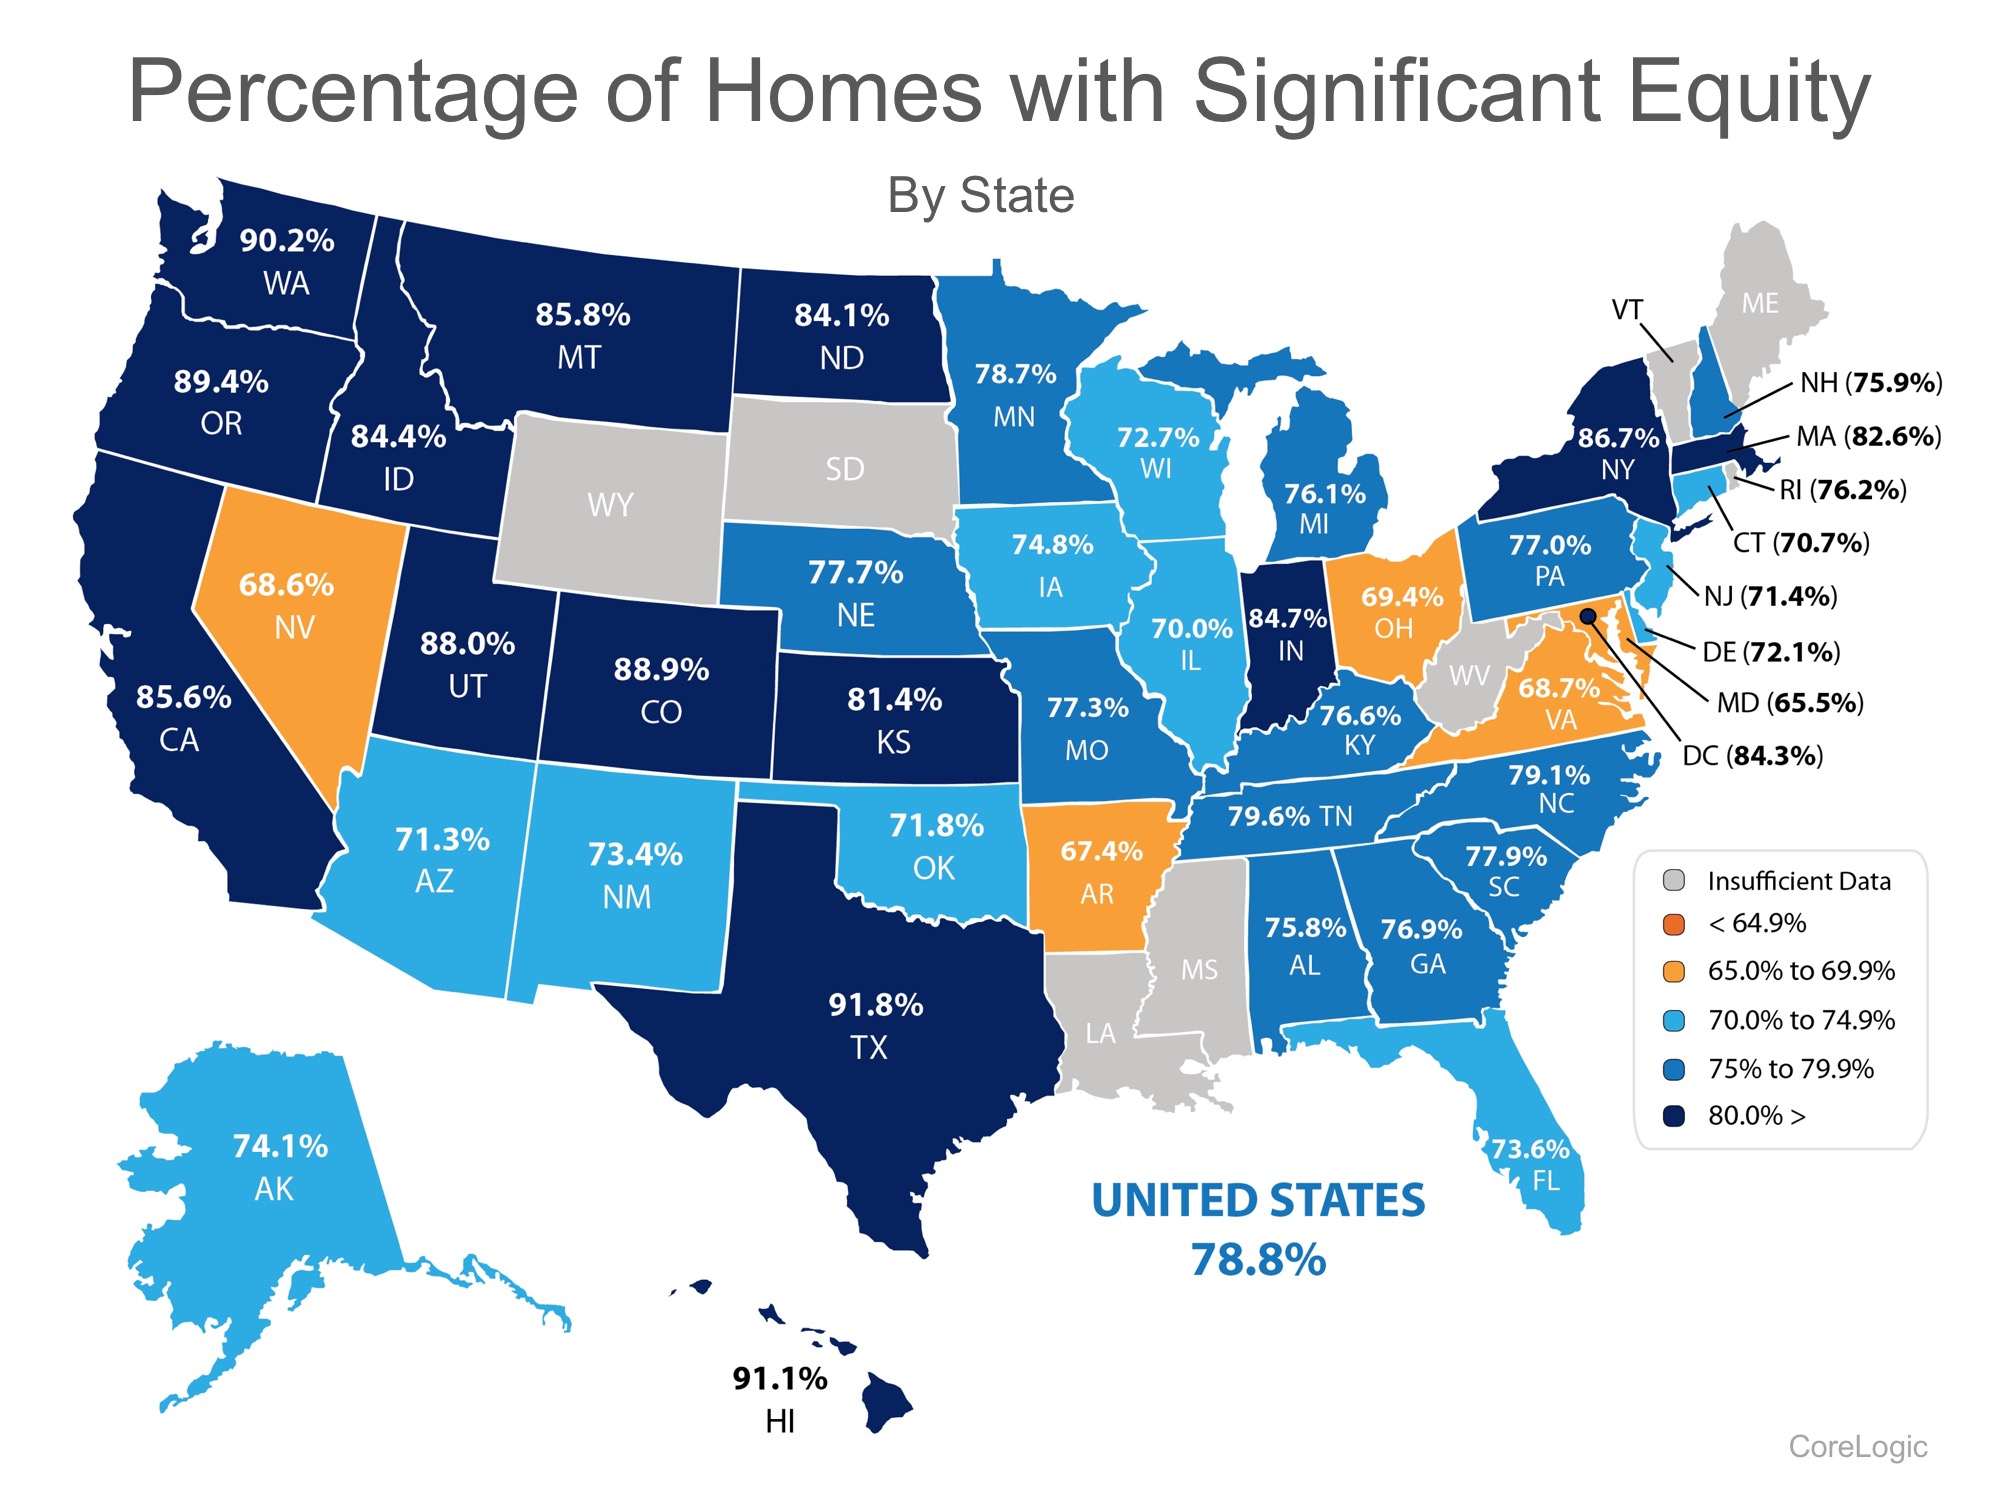
Of the 93.9% of homeowners with positive equity in the US, 78.8% have significant equity (defined as more than 20%). This means that nearly three out of four homeowners with a mortgage could use the equity in their current home to purchase a new home, now.

The map below shows the percentage of homes with a mortgage, in each state, that have significant equity. (The states in gray have insufficient data to report.)

93.9% Of Homes in The US Have Positive Equity | Simplifying The Market

Bottom Line 

If you are one of the many homeowners who are unsure of how much equity they have in their homes and are curious about their ability to move, let’s meet up to evaluate your situation.

Powered by WPeMatico

How Long Do Most Families Stay in Their Home?

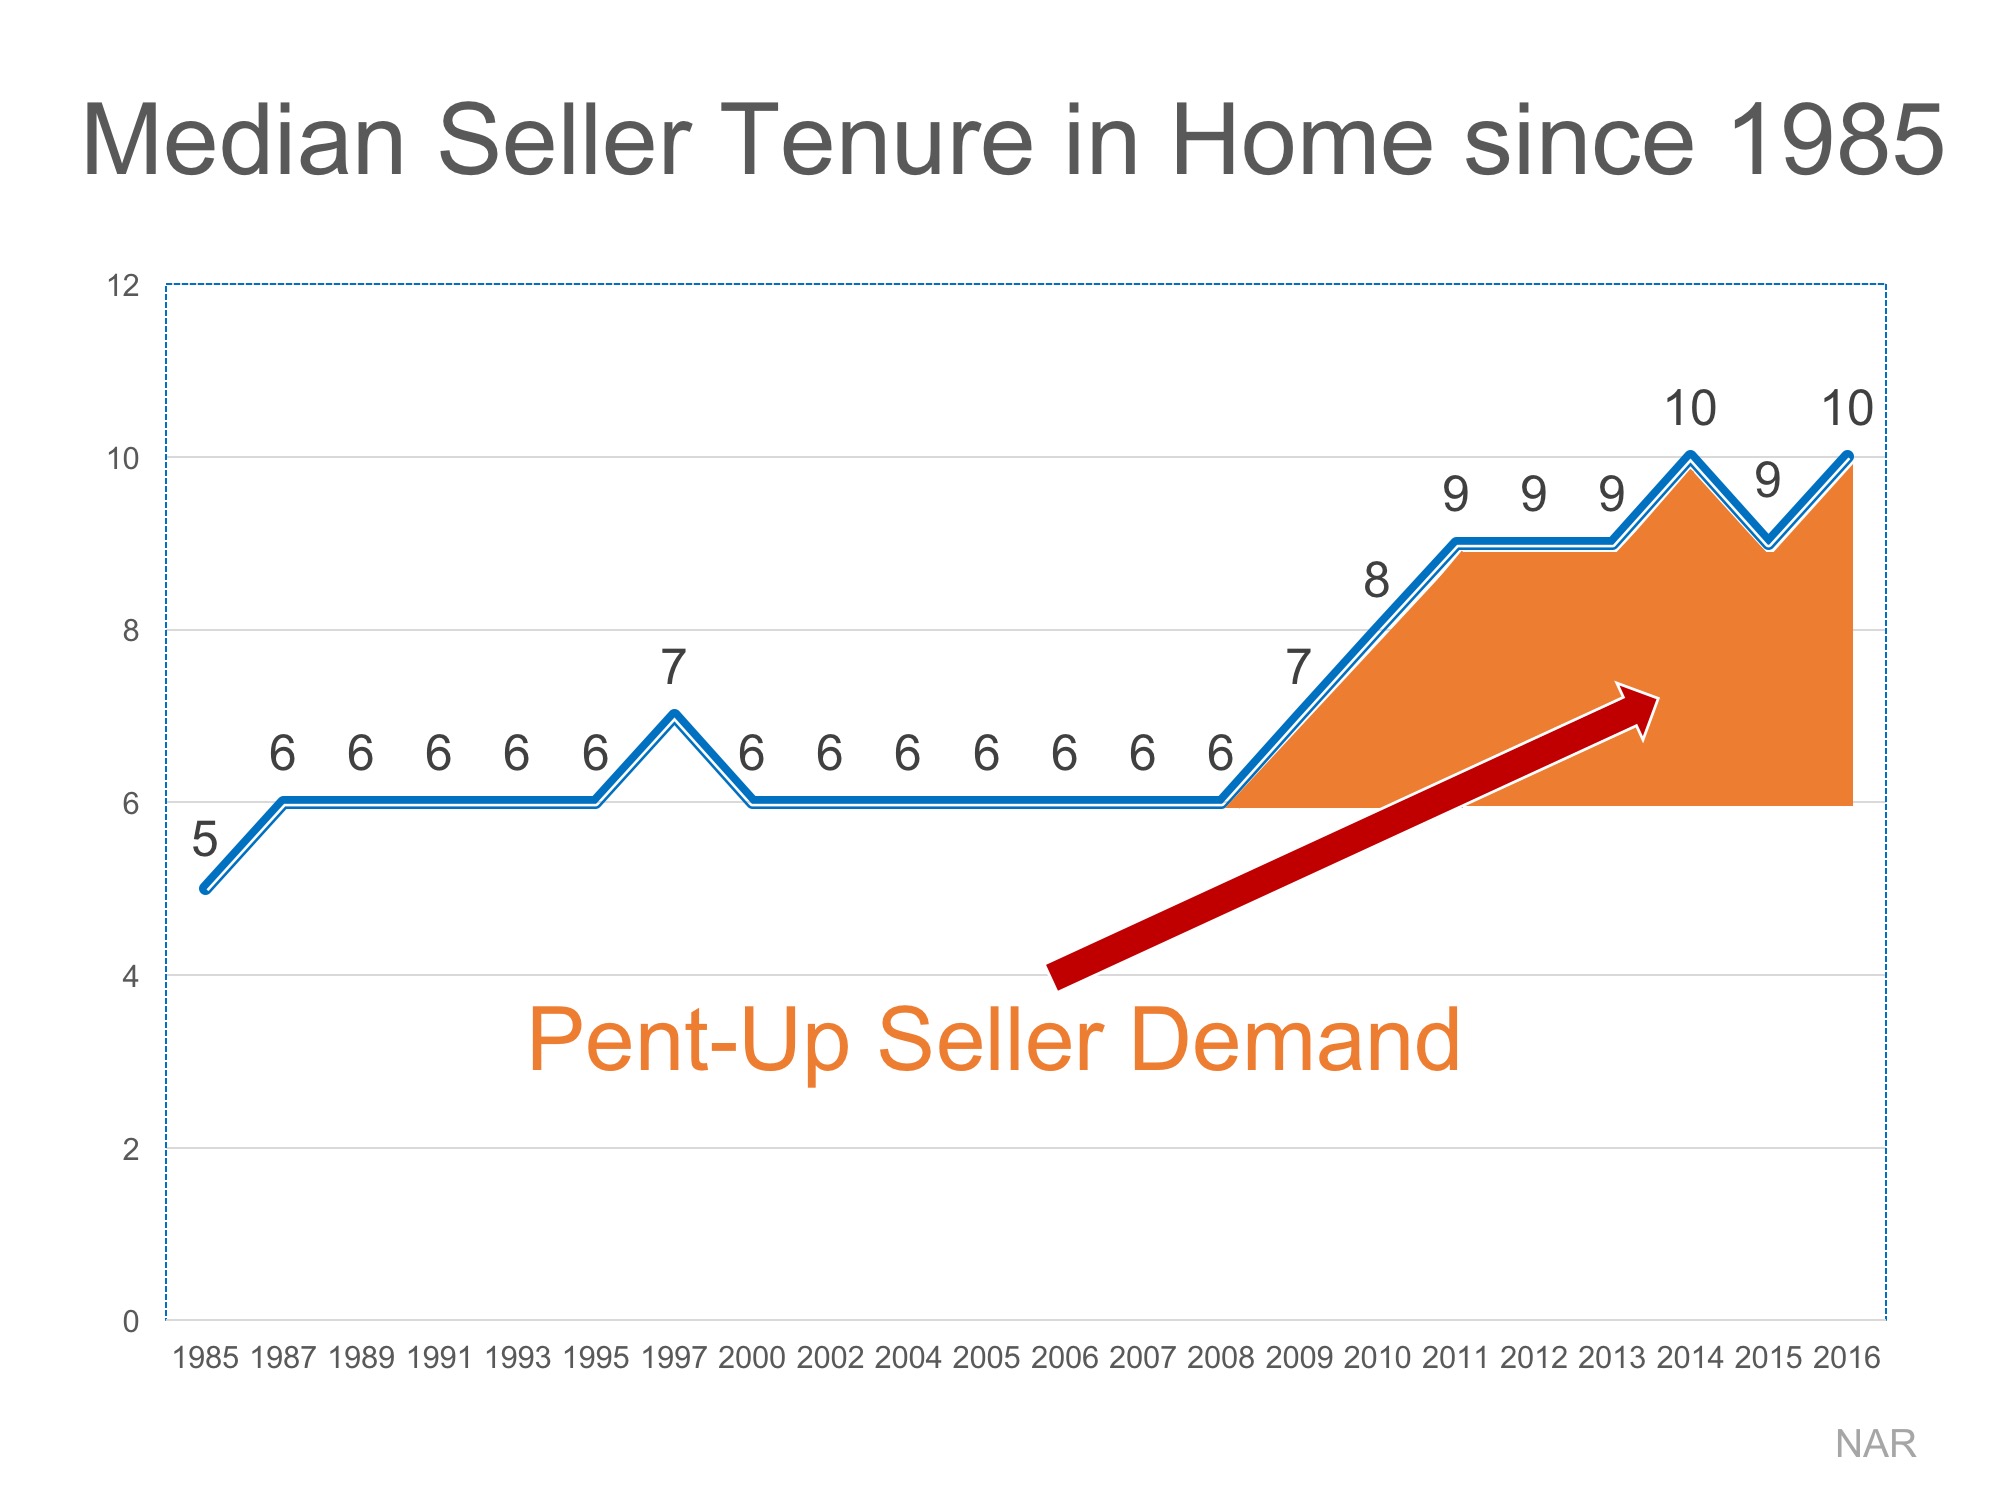
The National Association of Realtors (NAR) keeps historical data on many aspects of homeownership. One of the data points that has changed dramatically is the median tenure of a family in a home, meaning how long a family stays in a home prior to moving. As the graph below shows, for over twenty years (1985-2008), the median tenure averaged exactly six years. However, since 2008, that average is almost nine years – an increase of almost 50%.

How Long Do Most Families Stay in Their Home? | Simplifying The Market

Why the dramatic increase?

The reasons for this change are plentiful!

The fall in home prices during the housing crisis left many homeowners in a negative equity situation (where their home was worth less than the mortgage on the property). Also, the uncertainty of the economy made some homeowners much more fiscally conservative about making a move.

With home prices rising dramatically over the last several years, 93.9% of homes with a mortgage are now in a positive equity situation with 78.8% of them having at least 20% equity, according to CoreLogic.

With the economy coming back and wages starting to increase, many homeowners are in a much better financial situation than they were just a few short years ago.

One other reason for the increase was brought to light by NAR in their 2017 Home Buyer and Seller Generational Trends Report. According to the report,

Sellers 36 years and younger stayed in their home for six years…”

These homeowners who are either looking for more space to accommodate their growing families or for better school districts are more likely to move more often (compared to 10 years for typical sellers in 2016). The homeownership rate among young families, however, has still not caught up to previous generations, resulting in the jump we have seen in median tenure!

What does this mean for housing?

Many believe that a large portion of homeowners are not in a house that is best for their current family circumstance; They could be baby boomers living in an empty, four-bedroom colonial, or a millennial couple living in a one-bedroom condo planning to start a family.

These homeowners are ready to make a move, and since a lack of housing inventory is still a major challenge in the current housing market, this could be great news.

Powered by WPeMatico

20 Tips for Preparing Your House for Sale [INFOGRAPHIC]

20 Tips for Preparing Your House for Sale [INFOGRAPHIC] | Simplifying The Market

20 Tips for Preparing Your House for Sale [INFOGRAPHIC] | Simplifying The Market

Some Highlights:

  • When listing your house for sale your top goal will be to get the home sold for the best price possible!
  • There are many small projects that you can do to ensure this happens!
  • Your real estate agent will have a list of specific suggestions for getting your house ready for market and is a great resource for finding local contractors who can help!

Powered by WPeMatico

Millennial Homeownership Rate Increases

Millennial Homeownership Rate Increases | Simplifying The Market

Recent headlines exclaimed the homeownership rate, as reported by the Census Bureau, rose again in the second quarter of 2017. What didn’t get much attention in the reports is that the homeownership rate for American households under the age of 35 increased a full percentage point from last quarter’s 34.3% to 35.3%. Millennials proved to have the highest increase of any age group.

This came as a surprise to some considering Millennials have come to be known as the “renter” generation. However, a new study by First American, 6 Trends Poised to Reshape Homeownership Demand, revealed reasons why homeownership numbers will continue to increase for Millennials.

Millennials are the most educated generation in the U.S.

Why does that matter? First American explains:

“Our model shows that, all other factors being equal, the likelihood of homeownership increases by 3 percent for those that earn a bachelor’s degree over those with a high school degree. The likelihood of homeownership jumps another 3 percent for those that earn a graduate degree.”

The more educated, the better the likelihood for homeownership. And, as we mentioned: Millennials are the most educated generation in the U.S.

Homes & marriage go together

Marriage is a key determinate in homeownership. According to an analysis by First American, the homeownership rate is 30% higher among married couples compared to non-married households.

Millennials have put off marriage in the pursuit of higher education. As this group ages, more and more will marry and purchase a home.

Parents buy houses

According to the study:

“The homeownership rate is 1.7% higher for households with one or two children compared to households with no children, and it is 5.4 percent higher for households with three or more children.”

The report goes on to say that as Millennials grow older there may be an increase in not just marriage but also in married couples with children. That will probably also create a “corresponding” increase in homeownership demand.

Wages and the economy

The study goes on to explain that recent gains in income growth and a strengthening economy will also help all generations (including Millennials) be more willing and able to purchase a new home.

Bottom Line

We guess the time has come to announce – Here come the Millennials!!

Powered by WPeMatico

BUILDER CONFIDENCE

builderBuilder confidence for newly built single-family homes slipped three points to 62 in November from an upwardly revised October reading on the National Association of Home Builders/Wells Fargo Housing Market Index (HMI). The pullback is from an unusually high October reading. Still, builder confidence has hovered in the 60s for six consecutive months reflecting housing’s longer-term progress.

“Looking at these numbers this year has been like driving from house to house in a very nice neighborhood,” said Stephen Phillips, president of Berkshire Hathaway HomeServices. “Today’s number indicates slight variation in a very positive range, since anything above 50 indicates continued expansion. And we’re solidly above last year at this time. Nothing surprising, and a good report, overall.”

sphillipsSTEPHEN PHILLIPS is the president of Berkshire Hathaway HomeServices and COO of HSF Affiliates LLC. Find him on Twitter @swphillips7.

© 2016 BHH Affiliates, LLC. An independently operated subsidiary of HomeServices of America, Inc., a Berkshire Hathaway affiliate, and a franchisee of BHH Affiliates, LLC. Berkshire Hathaway HomeServices and the Berkshire Hathaway HomeServices symbol are registered service marks of HomeServices of America, Inc.® Equal Housing Opportunity.